
Education Trust Team Visualizes Michigan’s Digital Divide & Student Access to Virtual Instruction
The Education Trust-Midwest Team targeted the “digital divide” that affects students who may not have computer or internet access at home.
Introduction
COVID-19’s disruption of traditional in-person education led to a total reliance on virtual solutions, which puts students without internet/digital access at risk of falling through the cracks. The team’s primary goal was to create a map visualization of internet access rates per public school district in Michigan to serve as a tool for a coalition of policymakers. Specifically, legislators across the political spectrum could utilize this tool to advocate for state-level solutions.
Case Team Lead Evelyn Cai ‘22 worked with Maanas Kaza ‘20 (Northeastern MPP), Brittany Okorom-Achuonye ‘22, and Leila Wass ‘23 on this project. Ben Chiu ‘23 served as the Engagement Coordinator.
Methodology & Findings
The project involved data collection, analysis, and visualization. First, the team collected information on internet access rates per school district. In doing so, the team double checked all data for source validity, due to the potential of erroneous or duplicative data in the public sphere. For instance, the list of Michigan school districts and demographic data obtained from the Michigan State Department of Education did not match that from the Educational Entity Master and MI School Data. The team also joined county-level coronavirus-related datasets to demographic data, analyzing variables such as expenditure per pupil per school district, percentage of students of color, percentage of economically disadvantaged students.
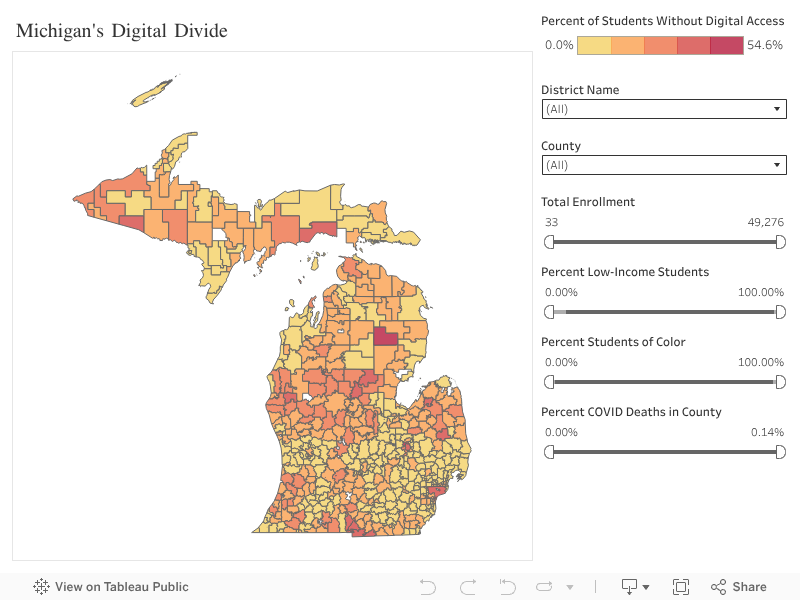
Next, the team explored the data using Tableau and generated a map visualization. The visualization illustrated a heatmap of internet access by school district, allowing users to scroll over the map and view other important metrics such as % of students of color, % of students on free/reduced lunch, county-level coronavirus case and death counts, and annual expenditure per pupil. In doing so, the team aimed to demonstrate how socioeconomic, demographic, or other factors may influence internet access, thereby putting certain student groups at a disadvantage in terms of educational access.
The map included interactive variable filters, so users could observe the heatmap by metrics of importance, answering questions such as: Are areas with more coronavirus cases also correlated to lower rates of internet access? Do larger school districts correlate with higher rates of internet access? Does the percentage of students of color correlate with anything?
Takeaways & Highlights
The final product — titled “Michigan’s Digital Divide” —was compiled and published by Mike Arbit, a policy fellow on the Education Trust-Midwest team. Main tweaks include design (how the user interacts with the visualization), wording (“students of color” rather than “minority”), and using 6/1/20 coronavirus data rather than the coronavirus data available on 5/1/20.
The Education Trust Team developed a meaningful tool for legislators seeking to expand equitable access to educational technology. Specifically, the interactive tool allows legislators to identify regions in which the digital divide is the largest and provides context for establishing next steps in the decision-making process.
One Education Trust Team member reflected fondly upon their experience: “I really enjoyed working with HDAG, as they allowed me to help make a difference with organizations that are doing important work in studying the effects of COVID-19. I liked that I got matched to a team that matched my interests in education and was based in my home state!”
This article reports the work of Harvard College Data Analytics Group’s COVID-19 Crisis Response Team. Edited by Kelsey Wu.