
UNICEF Global Team Analyzes YouTube, Reddit, Facebook, NYT, & Twitter Data
Introduction
Our UNICEF Global Team analyzed surveys and scraped data from popular media platforms like YouTube, Reddit, Facebook, The New York Times, and Twitter. They produced several reports for UNICEF that provide a snapshot of how the coronavirus pandemic has impacted the content and frequency of media consumption.
The Case Team Lead, Deepita Pai ‘20 (graduate researcher), worked with Daniel Abdulah ‘22, Brendan Devine ‘23, and Karina Halevy ‘23 to produce the final deliverable. Scott Mahon ‘22 served as the Engagement Coordinator for this team.
Methodology and Findings
During Week 1, the team analyzed the results of the Global Web Index’s March 25-30 survey of 4000 internet users in the US and UK. Grouping populations by generation (Gen-Z, Millennials, Gen X, and Boomers), they produced a list of observations about changes in online content preferences during the pandemic, including:
68% of users responded that they search for COVID-related updates. Millennials were more likely (71%) to be searching for COVID-related updates than other generations. Gen-Z, on the other hand, was the only age-group that was more likely to be streaming music (71%) than browsing news (67%).
Entertainment - such as listening to music, watching movies and TV shows was the second most popular activity amongst all age-groups. The most popular Entertainment activity is music-streaming.
58% of users responded that they spend most of their online time listening to music, of which Gen-Z listened to music the most out of all generations. However, when asked if they were consuming music-streaming more due to the outbreak, only 28% of Gen-Z responded yes. So overall, the pandemic has had little impact on the increased usage of music-streaming services.
Due to the outbreak, people are more willing to pay for subscription of entertainment services such as Netflix (18%), Disney+ (14%) and Amazon Prime (11%) while they're less willing to pay for news media services such as the NYTimes (9%), The Washington Post (7%) and the Guardian (5%).
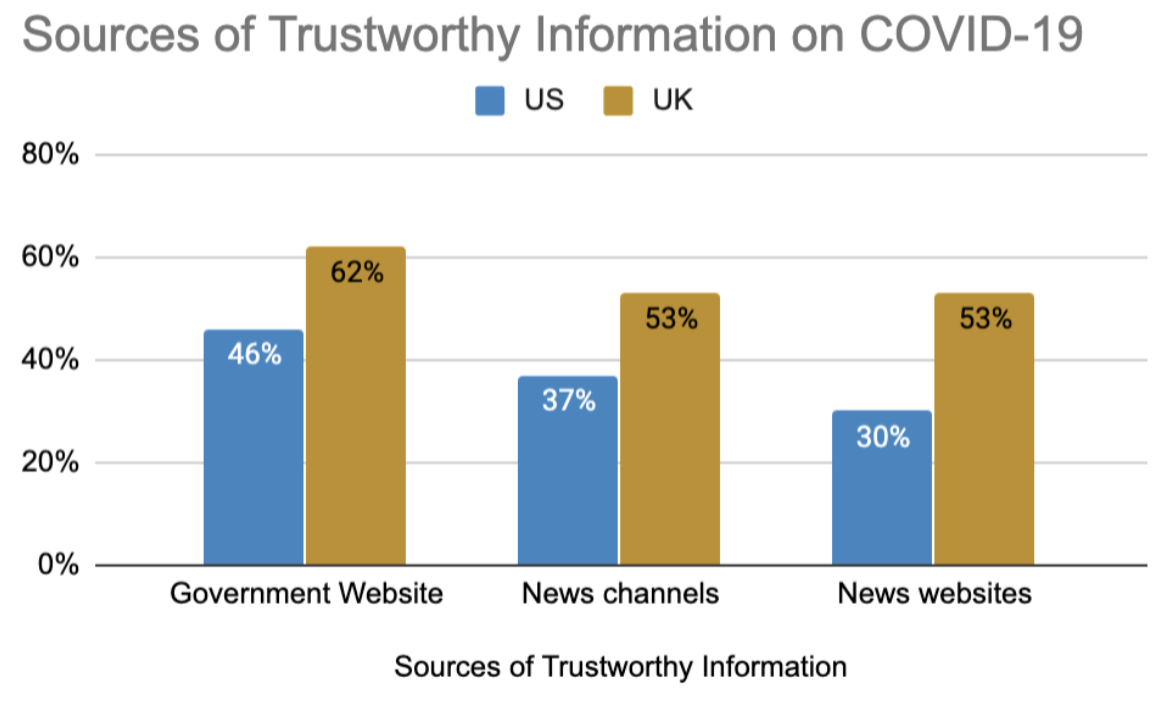
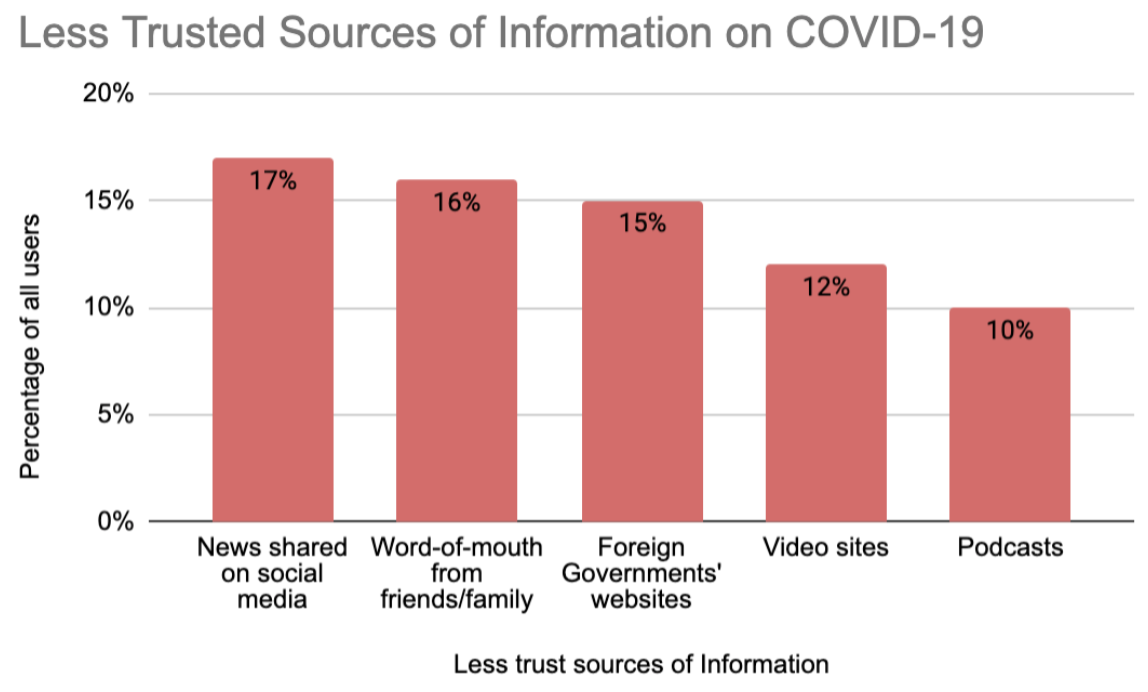
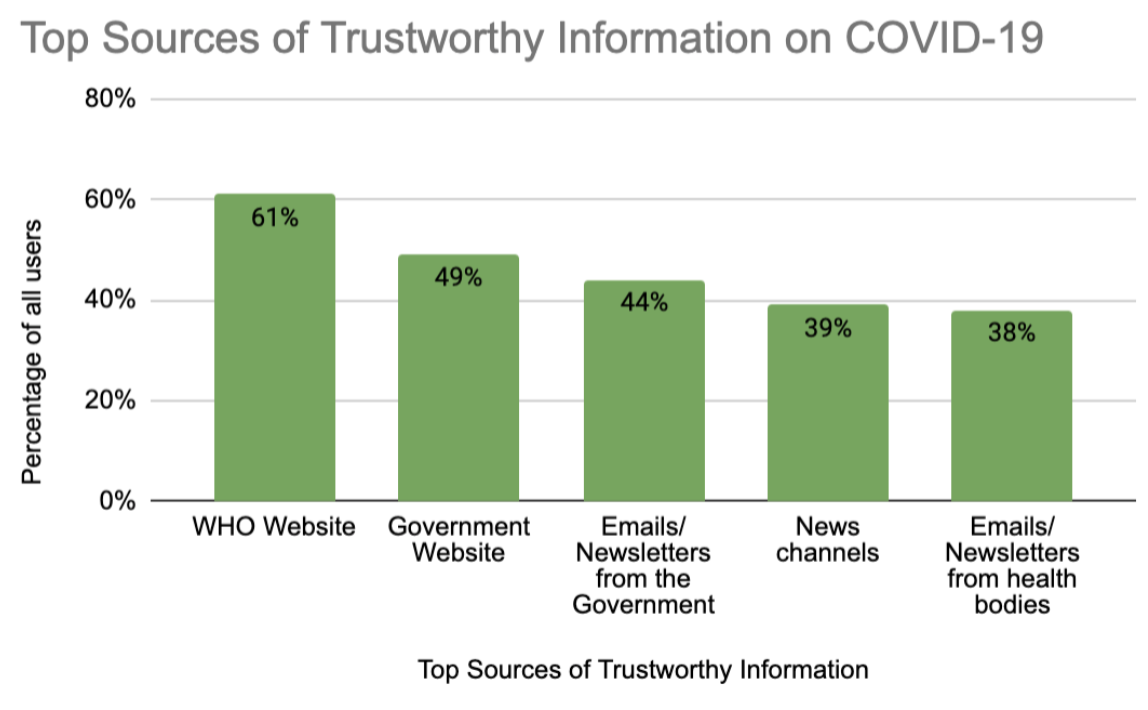
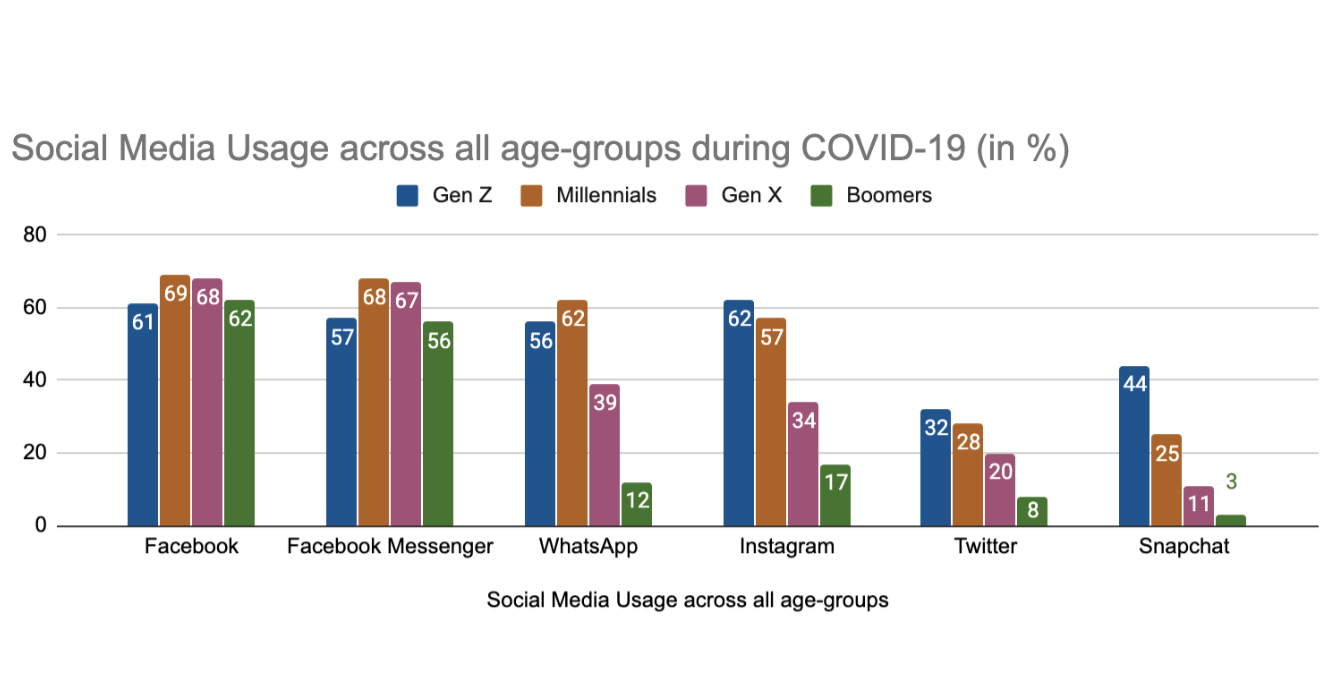
They also produced visualizations displaying the most/least trusted sources on COVID-19, social media usage across different platforms, and the different levels of trust in government websites and news channels between the US and the UK.
For the rest of the project, the team focused on investigating social media channel content on a case-by-case basis. Using APIs from YouTube, the New York Times, Reddit, and Twitter, they scraped articles with search queries relating to UNICEF’s mission.
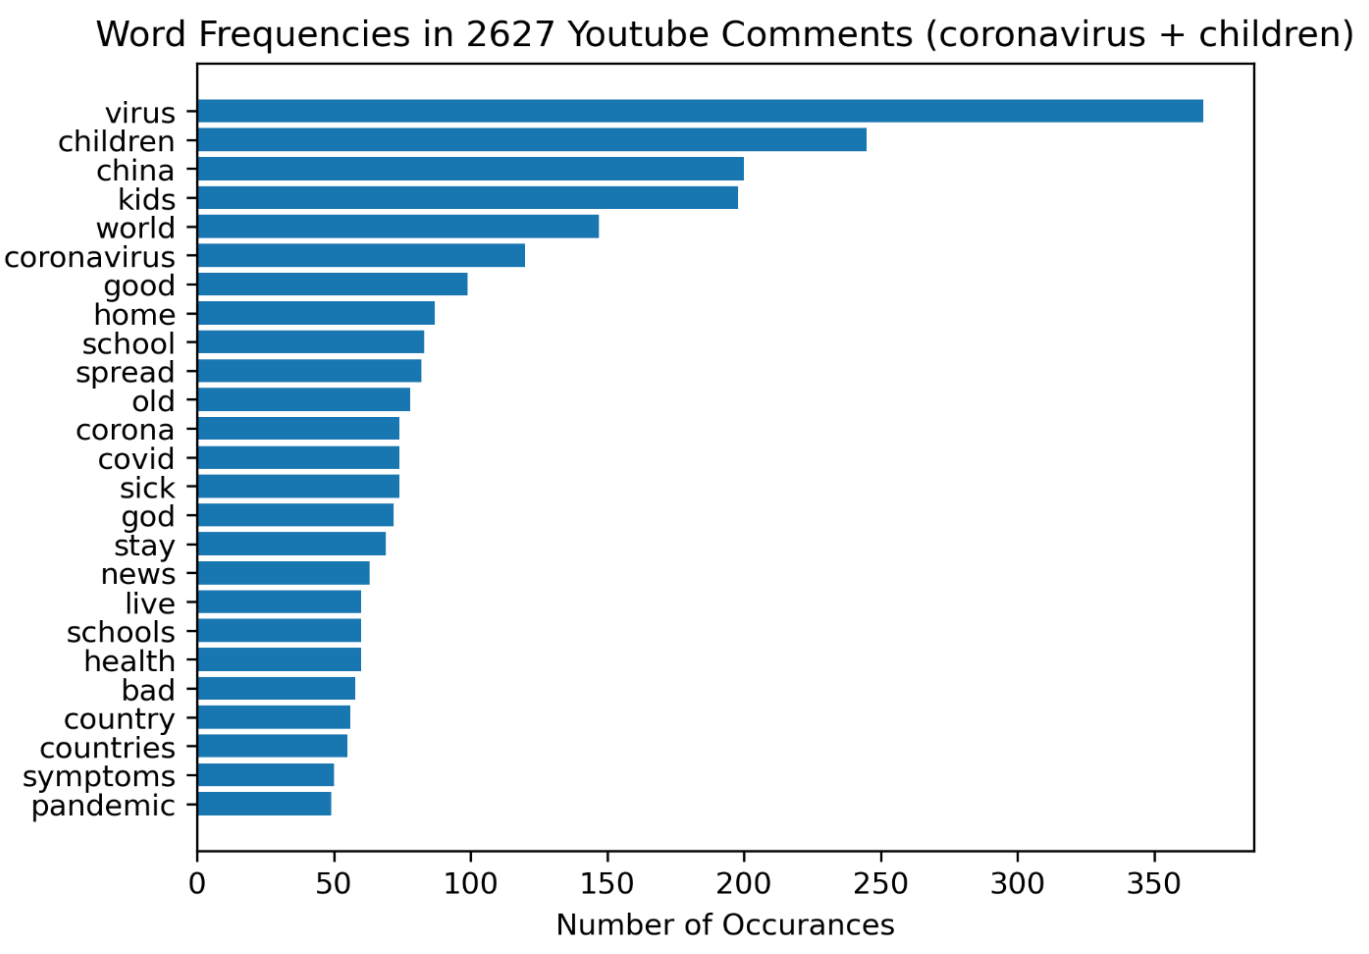
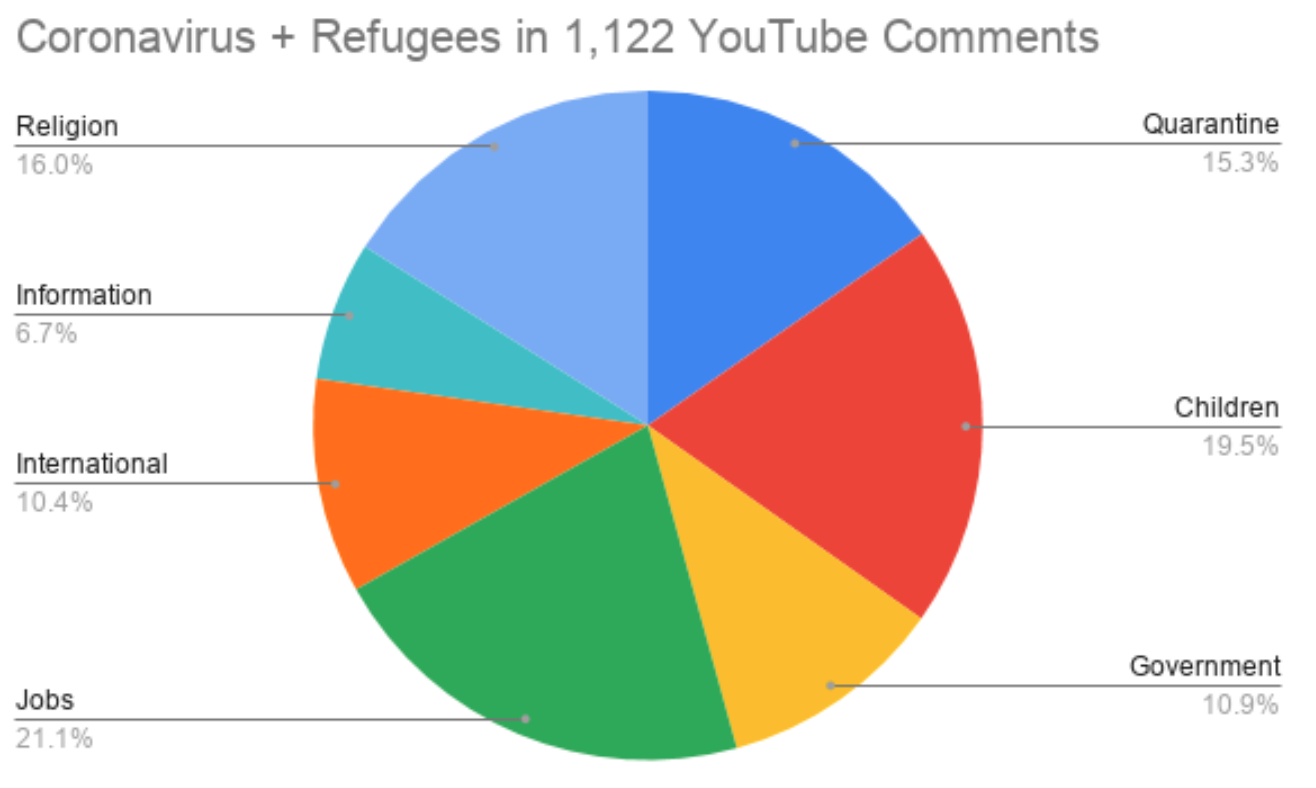
For instance, coronavirus + refugees was the query used on YouTube, while the terms covid, covid child abuse, covid domestic violence, covid mental abuse, and covid children poverty helped the team scrape the New York Times database. The API call returned metadata for each article or post — the headline, key words, abstract, lead snippet, and lead paragraph. The team them concatenated all relevant text into one string and tokenized the string using natural language processing tools (NLTK and spaCy). They created a reference word list with terms relating to UNICEF’s goals during the pandemic, such as government, children, school, sick, death, and hospital. Once the long string of text was prepared, team members used the reference list to remove high frequency filler words such as “the” and “a.”
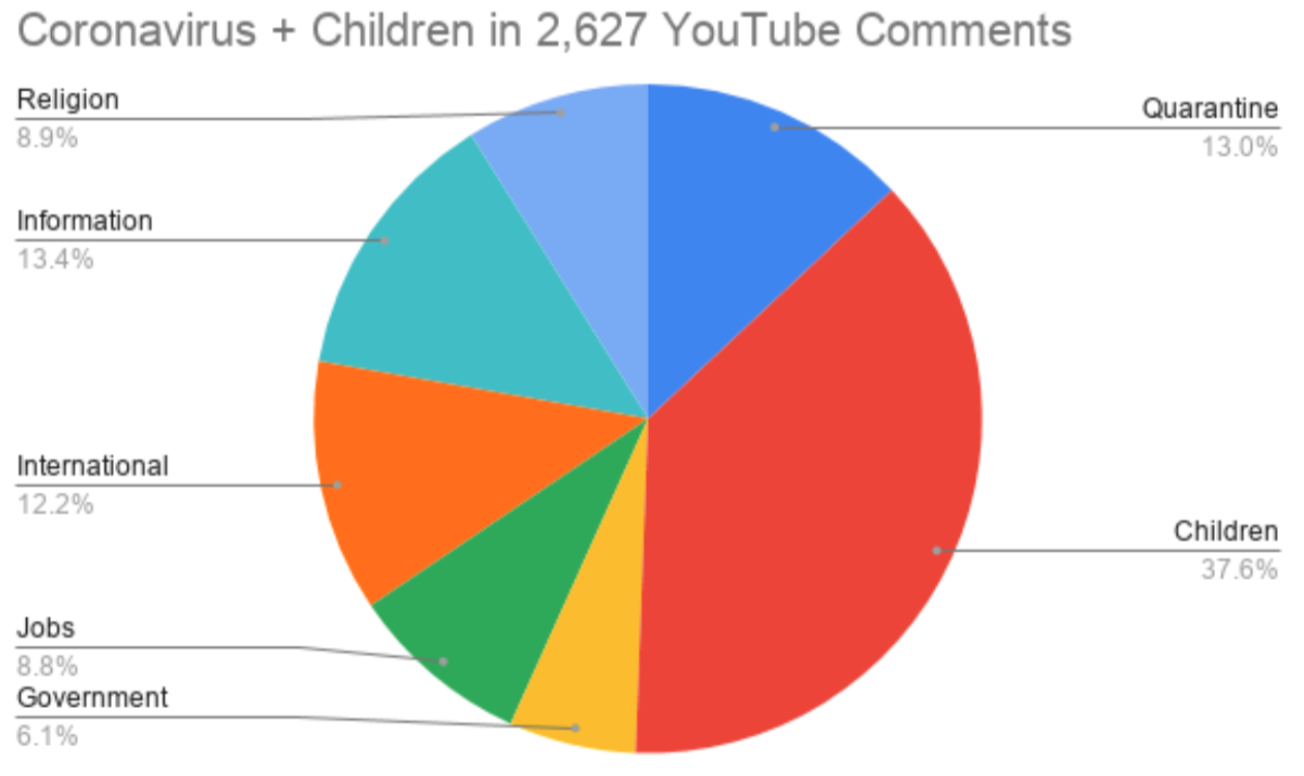
For each media channel, the team found the 35 most commonly used words (in the collected string) and the number of occurrences for each word. The team also grouped these words into broader categories (e.g. “kids,” “school,” and “children” were grouped into the category of “Children”) and visualized relative frequencies of each theme on each media channel.
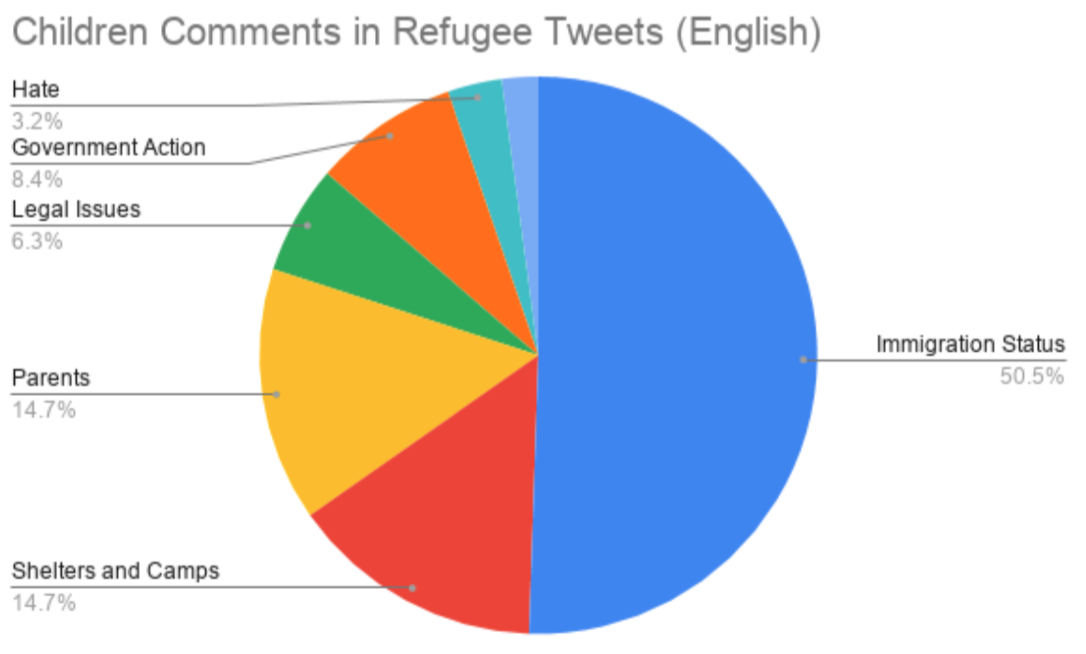
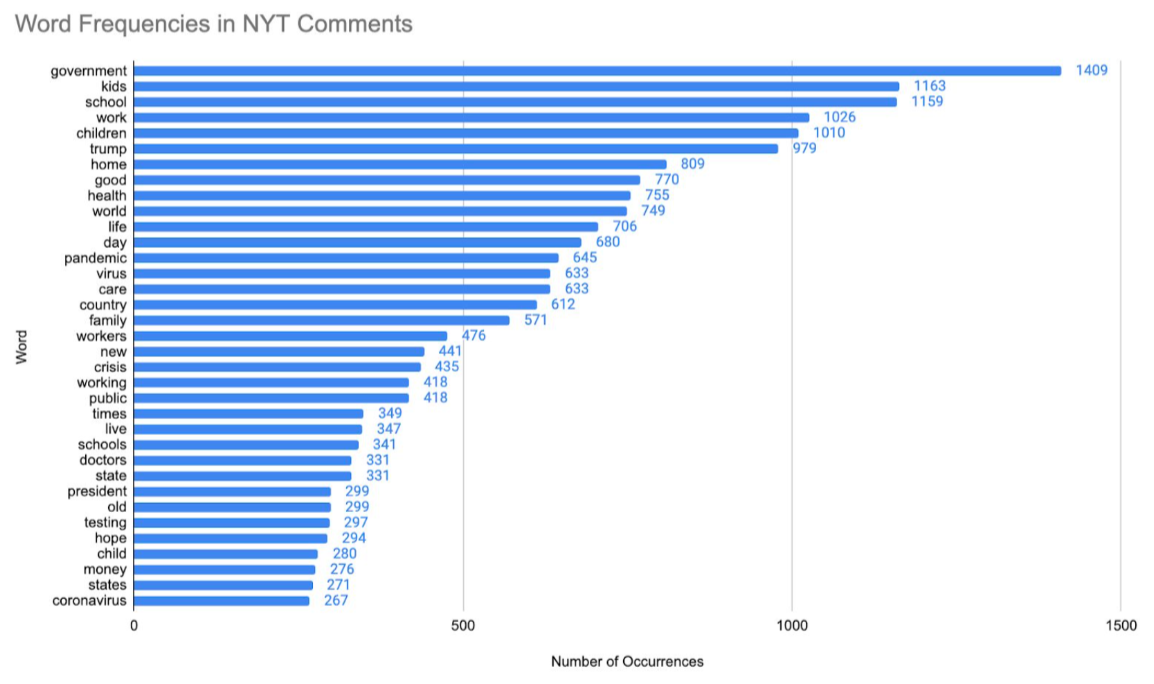
Unsurprisingly, the team varied data collection methodology for each media channel to fit the nature of specific platforms. For example, the team filtered for 2020 results on the New York Times website, while they examined the 20 most popular posts (based on the “hot” label) from the 10 most widely used coronavirus-related Subreddits. The deliverable for each outlet included similarly styled graphics and the same word reference list. In Week 4, the team also examined international news sources with similar methodology, generating a series of pie charts to illustrate different focuses of each country.
Through quantitative text analysis, natural language processing, and data visualization, the team revealed fascinating insights about social media and news outlet usage during the pandemic. Particularly, they tailored search terms to UNICEF’s goals. In a society that is becoming increasingly digital, the team’s findings help organizations — especially ones like UNICEF that target global populations — harness the power of data-driven intelligence to improve strategy.
This article reports the work of Harvard College Data Analytics Group’s COVID-19 Crisis Response Team. Edited by Kelsey Wu.